Starting with this entry, we’re going to begin talking about the environment — air, sunlight, water, and more.
We’ve already talked a great deal about diet, exercise, and sleep.
But there is one variable that is more frequent than food, more continuous than exercise, and more unavoidable than sleep — air.
Air is not a free backdrop. It is the most frequent “input” that keeps us alive. A person breathes about 20,000 times a day, and every particle in the air is deeply involved in our physiology and metabolism.
And the air-quality metric most people know best is PM2.5.** So today, let’s talk about it**.
1. What Is PM2.5? Particles Measured in Microns
PM2.5 refers to particulate matter with a diameter of 2.5 microns or less — about one-twentieth the width of a human hair. Precisely because it is so extraordinarily small, it slips past multiple defensive barriers in the respiratory tract. Most particles are intercepted by nasal hair and mucous membranes, but PM2.5 can drive straight through and reach the alveoli deep in the lungs.
It can even pass through the air-blood barrier and enter the bloodstream directly. Some even smaller particles — especially ultrafine particles with a diameter of ≤0.1 micron, known as PM0.1 1,2 — can even cross the blood-brain barrier.
That means PM2.5 becomes a chronic, low-dose inflammatory stimulus, deeply and broadly participating in the body’s metabolic processes. It can trigger oxidative stress, activate chronic inflammatory pathways, and thereby raise risks across the cardiovascular, pulmonary, and even nervous systems.
2. Why PM2.5 Is So Harmful
There is no meaningful “safe minimum” for PM2.5. Lower is simply better. Its association with disease risk rises as its concentration rises. In 2021, the World Health Organization (WHO) updated its global air quality guidelines and set the 24-hour average limit for PM2.5 at 15 micrograms per cubic meter. That does not mean anything below 15 is harmless. It is better understood as a kind of “cost-effectiveness red line.” After all, in the real world, there is no environment with absolutely zero PM2.5. This threshold is the gold standard built on the medical consensus that even low-level exposure still causes health damage 3,4.
In epidemiological research,** PM2.5 is currently the most sensitive and most widely used indicator for measuring the relationship between air pollution and** all-cause mortality.
Scientists have found that across countries and climate conditions, fluctuations in PM2.5 closely track population-level curves in cardiovascular mortality and cancer mortality. Compared with PM10, PM2.5 predicts a region’s overall health status and life expectancy more accurately. So whether we look at it from the perspective of public health or individual practice, PM2.5 is the air metric with the highest “governance ROI”: lower it, and you can meaningfully extend life 41,42.
From lung cancer to COPD
When air pollution comes up, the most immediate fear for many people is lung cancer. That fear is not unfounded. The International Agency for Research on Cancer (IARC) has classified outdoor air pollution and PM2.5 as Group 1 carcinogens — the highest level of carcinogenic classification, meaning the evidence is extremely strong 5,6.
Data show that for every 10 micrograms per cubic meter increase in PM2.5 concentration, lung cancer risk rises by roughly 8–14% 7,8. For any individual, that absolute risk is still far lower than the risk from smoking. But because air exposure is universal, continuous, and impossible to fully avoid, its public-health impact runs very deep. These tiny particles carry heavy metals and polycyclic aromatic hydrocarbons (PAHs), which can directly cause oxidative DNA damage and create a persistently inflamed microenvironment in the lungs — laying the groundwork for mutations in epithelial cells 5,6.
Beyond cancer, PM2.5 is also directly linked to chronic obstructive pulmonary disease (COPD). Like cancer, COPD is one of the “Five Horsemen of Death” and one of the major causes of human mortality. Long-term exposure to high concentrations of PM2.5 not only significantly raises the incidence of COPD, but also accelerates the decline in lung function. This dose-response relationship is very clear in epidemiology: it drives airway remodeling and protease imbalance, making our respiratory system “age” ahead of schedule 9,10.
PM2.5 is also a major driver of cardiovascular disease
Most people think air pollution mainly damages the lungs. But the actual data are harsher: among excess deaths attributable to air pollution, cardiovascular disease accounts for far more than lung cancer 11,12. In the 2019 Global Burden of Disease study, more than 56% of all PM2.5-related deaths were cardiovascular, while lung cancer accounted for only about 7%.
The systemic inflammation triggered by PM2.5 acts directly on the vascular endothelium, accelerates atherosclerosis, and can even provoke arrhythmias. Protecting your breathing environment is also protecting your heart and blood vessels 1.
The American Heart Association, integrating long-term follow-up data published in The New England Journal of Medicine and The Journal of the American Medical Association, concluded that for every 10 micrograms per cubic meter increase in PM2.5 concentration, mortality risk from cardiovascular disease rises by about 10%–16%, and stroke risk rises by about 11% 1,13,14.
So PM2.5 is directly related to all three major categories of death: cancer, COPD, and cardio-cerebrovascular disease. But because we don’t feel it in the moment, we often treat it as background scenery and ignore its enormous cumulative harm. That is dangerous.
3. Managing PM2.5 Starts with Understanding AQI
Most weather apps — Apple Weather, for example — include an AQI reading.
AQI, or the Air Quality Index, is a bundled score derived from the concentrations of multiple pollutants (such as PM2.5, sulfur dioxide, nitrogen dioxide, and so on). The higher the score, the greater the health risk. The underlying algorithm is complex, but PM2.5 is one of its core variables. On smoggy days, AQI is usually dominated by PM2.5, so in day-to-day life we can think of AQI as a rough “health scoreboard” for PM2.5 levels.
But one thing needs special emphasis: AQI standards are not globally uniform. Different countries use standards that are meaningfully shifted from one another.
As mentioned above, in 2021 the WHO set the 24-hour average limit for PM2.5 at **15 micrograms per cubic meter **3.
So what does 15 micrograms per cubic meter actually mean?
Under China’s AQI system, it corresponds to roughly AQI 22 (“excellent”). Under the U.S. AQI system, it corresponds to roughly AQI 62 (“moderate”).
And an AQI of 50 or below is considered excellent. Under China’s standard, that upper bound corresponds to 35 micrograms per cubic meter, while under the U.S. standard it corresponds to 9 micrograms per cubic meter. The charts below make this more intuitive [15–18].
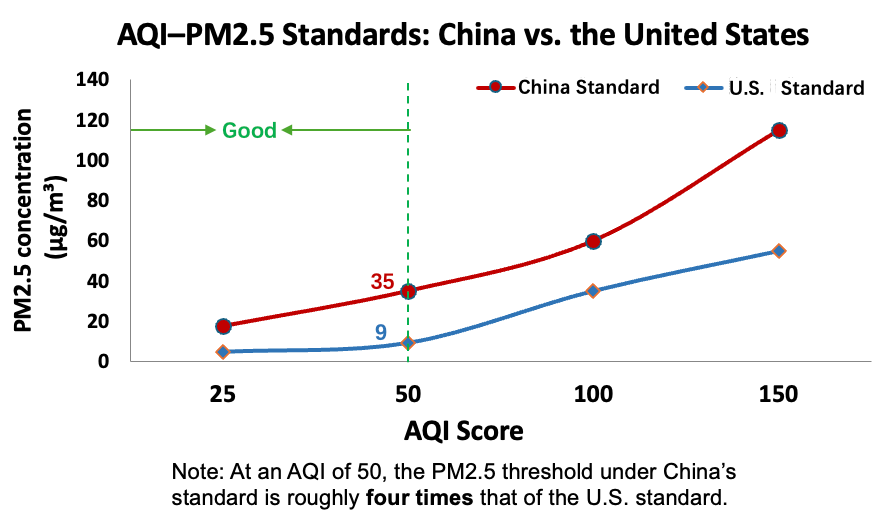
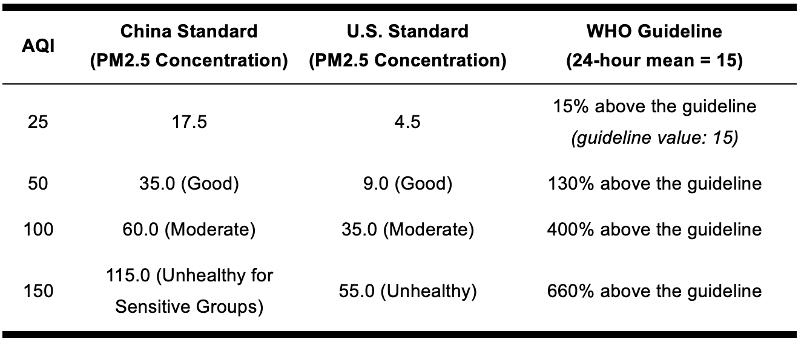
The China data above are drawn from the Technical Regulation on Ambient Air Quality Index (AQI) (HJ 633–2026), which took effect on March 1, 2026.
AQI is not determined by a single pollutant. In China, sub-indices (IAQI) are calculated separately for six pollutants — carbon monoxide, nitrogen dioxide, sulfur dioxide, ozone, PM10, and PM2.5 — and the maximum of those values (that is, the day’s primary pollutant) becomes the final AQI. All calculations in this article assume PM2.5 is the dominant pollutant on that day.
A rough but practical way to think about it is this: China’s AQI standard is 2–4 times more lenient than the WHO and U.S. standards.
That creates a very important cognitive gap. When China’s AQI reads 50 (“excellent”), the corresponding upper bound for PM2.5 is 35 micrograms** per cubic meter.** Under the U.S. standard, that same concentration is already close to AQI 100, on the edge of light pollution. Measured against the WHO guideline, it exceeds the standard by a full 130%.
Understanding what AQI really means matters a lot. As Prime Lifers, our day-to-day reference point should not simply be “AQI below 100” (which is still classified as good or acceptable air in many systems). From a more conservative and more prudent perspective, we should also take the WHO line seriously.
- The WHO standard (15 micrograms per cubic meter) is roughly equivalent toChina AQI 22.
- The U.S. PM2.5 “good” standard (9 micrograms per cubic meter) is roughly equivalent toChina AQI 13.
- Forlight aerobic exercise (such as Zone 2), it is best to staybelowChina AQI 50(roughly PM2.5 ≤ 35 micrograms per cubic meter).
- Forhigh-intensity exercise (such as competitive ball sports), it is best to staybelowChina AQI 20–25(roughly in line with the WHO standard), where you are finally getting closer to a genuinely safer breathing zone.
- Once AQI risesabove50, whether indoors or outdoors, it becomes necessary to use additional tools — fresh-air systems, air purifiers, masks, and so on — to effectively reduce PM2.5 exposure.
4. More Practical Variables and Interventions
Since we can’t exactly move off planet Earth, how do we reduce PM2.5 exposure in practical terms? Let’s use an outdoor China national AQI of 150 as a benchmark — which corresponds to a PM2.5 concentration of about 115 micrograms per cubic meter, or moderate pollution — and look at how different interventions reduce PM2.5:
Indoors vs. outdoors
In a closed indoor space with no obvious indoor pollution source, PM2.5 concentration is typically about 50%–70% of the outdoor level [19–21].
Choosing a mask
Ordinary medical masks provide relatively limited protection against PM2.5 — roughly 30%–70% reduction, with real-world performance depending heavily on how well the mask seals. By contrast, the “95%” in N95 refers to the minimum filtration efficiency for 0.3-micron particles, which are actually among the hardest to filter. Most PM2.5 particles are larger than 0.3 microns, so with a good fit, an N95’s overall filtration efficiency against PM2.5 is typically no lower than 95%. On smoggy days, it is the clear best choice [22–23].
Air purifiers (HEPA)
Air purifiers equipped with HEPA filters are currently one of the most effective and reliable tools for controlling indoor PM2.5. Most measurement studies show reductions in the range of 30%–60%. Under ideal conditions — a well-sealed room and continuous HEPA operation — the reduction can be even greater [24–26]. Using outdoor PM2.5 ≈115 μg/m³ (China AQI 150, moderate pollution) as an example:
- With windows closed and the room simply sealed, indoor concentration is usually about 50%–70% of outdoor levels.
- If, on top of that, you run a HEPA purifier sized appropriately for the room, indoor PM2.5 can,under good conditions, stabilize at around25–55 μg/m³, clearly below the outdoor level. In a well-sealed space with sufficient machine power, it can approach15–25 μg/m³over shorter periods. The exact level depends on building leakage and the purifier’s clean air delivery rate (CADR).
Even if the room is somewhat larger than the purifier’s rated coverage area, you can still get a clear drop in concentration. You just get fewer effective air changes per hour, it takes longer to reach equilibrium, and the final steady-state PM2.5 level will be somewhat higher.
Kitchen oil fumes
This is one of the easiest exposure spikes to overlook. During peak cooking, especially in kitchens with poor natural ventilation or without the effective use of an externally vented range hood, localized PM2.5 can instantly surge past 500–1000, reaching levels dozens of times above the WHO safety boundary. This kind of short-term, high-concentration exposure is every bit as damaging as a severe smog event. It is also one of the main reasons Prime Lab does not recommend high-heat, heavy-oil stir-frying as a cooking style 27,28.
Firsthand smoke vs. secondhand smoke
Another major indoor PM2.5 explosion comes from cigarettes. In a typical office of about 20 square meters, lighting a single cigarette can create an instantaneous PM2.5 peak of 600 to 800 micrograms per cubic meter, pushing air quality directly into an “extremely dangerous” range 29,30.
What is even more counterintuitive is that secondhand smoke (sidestream smoke) is often higher in particle concentration and more toxic than firsthand smoke. Because a burning cigarette smolders at a lower temperature when not being puffed, the combustion is less complete. As a result, sidestream smoke releases several times more PM2.5 than mainstream smoke, and the toxicity per gram of particulate matter is higher. At the same time, secondhand smoke particles are smaller — often PM1.0 and below — making it easier for them to bypass the body’s natural defenses and penetrate deep into the alveoli and bloodstream 31.
TheBMJreported toxicology data from tobacco-industry sidestream smoke experiments showing that, gram for gram, the probability of tumor induction from secondhand smoke condensate is 2–6 times that of firsthand smoke, and its overall toxicity is about 4 times higher 31,32.
If someone smokes in an enclosed space, PM2.5 spreads rapidly, and there is no such thing as a “safe distance.” Outdoors, particle concentration only falls off quickly when the smoker is more than about 10 meters downwind. A very simple and practical rule of thumb is this: if you can smell smoke, you are inhaling secondhand smoke pollution — a mix of particulate matter and toxic gases — and should treat that as an exposure signal to avoid [33–35].
E-cigarettes are not “air-friendly” either. E-cigarettes release highly concentrated ultrafine aerosols, and their PM2.5 concentrations are fully capable of rapidly degrading indoor air quality. More troublingly, their particles are smaller still and may damage the integrity of the blood-brain barrier. Their sweet smell also makes them deceptively easy to ignore, which means bystanders may inhale large numbers of heavy-metal particles without realizing it.
**By Prime Lab standards, e-cigarettes and traditional cigarettes are the same in one critical sense: both are pollution sources that need to be excluded from any truly clean microenvironment **[36–40].
A Quick Summary
Actively managing air quality is a high-leverage health investment.
Its invisibility can even become an advantage: once the right adjustments are in place, better air can improve our 20,000 daily breaths without demanding major changes to the rest of our habits.
Taking all of the practical suggestions above together, Prime Lab’s view is this: PM2.5 may be more pervasive, but we already have enough effective tools to substantially reduce it. Outdoors, keep an eye on the AQI (<50) and use N95 masks well. Indoors, use air purifiers well and avoid high-fume, high-heat stir-frying. And whether indoors or outdoors, stay away from both cigarettes and e-cigarettes.
Intervention recommendations are geared toward generally healthy individuals. If you have existing health conditions, always follow your doctor’s instructions.
References
[1]Brook RD, Rajagopalan S, Pope CA 3rd, et al. Particulate matter air pollution and cardiovascular disease: An update to the scientific statement from the American Heart Association. Circulation. 2010;121(21):2331–2378.
[2]Maher BA, Ahmed IA, Karloukovski V, et al. Magnetite pollution nanoparticles in the human brain. Proc Natl Acad Sci U S A. 2016;113(39):10797–10801.
[3]World Health Organization. WHO global air quality guidelines: particulate matter (PM2.5 and PM10), ozone, nitrogen dioxide, sulfur dioxide and carbon monoxide. World Health Organization; 2021.
[4]Di Q, Wang Y, Zanobetti A, et al. Air Pollution and Mortality in the Medicare Population. N Engl J Med. 2017;376(26):2513–2522.
[5]Loomis D, Grosse Y, Lauby-Secretan B, et al. The carcinogenicity of outdoor air pollution. Lancet Oncol. 2013;14(13):1262–1263.
[6]International Agency for Research on Cancer. IARC: Outdoor air pollution a leading environmental cause of cancer deaths. Press Release №221. Lyon/Geneva: IARC; 2013 Oct 17.
[7]Hamra GB, Guha N, Cohen A, et al. Outdoor particulate matter exposure and lung cancer: a systematic review and meta-analysis. Environ Health Perspect. 2014;122(9):906–911.
[8]Turner MC, Krewski D, Pope CA 3rd, et al. Long-term ambient fine particulate matter air pollution and lung cancer in a large cohort of never-smokers. Am J Respir Crit Care Med. 2011;184(12):1374–1381.
[9]Park J, Han CH, Lee S, et al. Long-term exposure to ambient PM2.5 and chronic obstructive pulmonary disease: A systematic review and meta-analysis. Clin Respir J. 2021.
[10]Bo Y, Guo C, Lin C, et al. Long-term exposure to fine particulate matter and development of chronic obstructive pulmonary disease in adults: A prospective cohort study. Environ Int. 2021.
[11]Cohen AJ, Brauer M, Burnett R, et al. Estimates and 25-year trends of the global burden of disease attributable to ambient air pollution: an analysis of data from the Global Burden of Diseases Study 2015. Lancet. 2017;389(10082):1907–1918.
[12]Murray CJL, Aravkin AY, Zheng P, et al. Global burden of 87 risk factors in 204 countries and territories, 1990–2019: a systematic analysis for the Global Burden of Disease Study 2019. Lancet. 2020;396(10258):1223–1249.
[13]Yuan S, Wang J, Jiang Q, et al. Long-term exposure to PM2.5 and stroke: A systematic review and meta-analysis of cohort studies. Environ Res. 2019;177:108587.
[14]Hoek G, Krishnan RM, Beelen R, et al. Long-term air pollution exposure and cardio- respiratory mortality: a review. Environ Health. 2013;12(1):43.
[15]Ministry of Environmental Protection of the People’s Republic of China. Ambient air quality standards (GB 3095–2012). 2012.
[16]Ministry of Environmental Protection of the People’s Republic of China. Technical Regulation on Ambient Air Quality Index (on trial) (HJ 633–2012). 2012.
[17]U.S. Environmental Protection Agency. Final Updates to the Air Quality Index (AQI) for Particulate Matter — Fact Sheet and Common Questions. 2024 Feb 7.
[18]U.S. Environmental Protection Agency. Final reconsideration of the National Ambient Air Quality Standards for Particulate Matter: primary annual PM2.5 standard set at 9.0 µg/m³ (final rule). 2024.
[19]Chen C, Zhao B. Review of relationship between indoor and outdoor particles: I/O ratio, indoor contribution and penetration factor. Atmos Environ. 2011;45(2):275–288.
[20]Choi DH, Kang DH. Infiltration of ambient PM2.5 through building envelope in apartment housing units. Aerosol Air Qual Res. 2017;17:598–607.
[21]MacNeill M, Wallace L, Kearney J, et al. Factors influencing variability in the infiltration of PM2.5 mass and its components. Atmos Environ. 2012;61:518–532
[22]Cherrie JW, Apsley A, Cowie H, et al. Effectiveness of face masks used to protect Beijing residents against particulate air pollution. Occup Environ Med. 2018;75(6):446–452.
[23]Wang AB, Zhang Y, et al. A review of filtration performance of protective masks. [systematic review] 2023.
[24]Allen RW, Carlsten C, Karlen B, et al. Air filtration intervention study of endothelial function among healthy adults in a woodsmoke-impacted community. Am J Respir Crit Care Med. 2011.
[25]Maestas MM, et al. Reduction of personal PM2.5 exposure via indoor air filtration intervention. Sci Total Environ. 2018.
[26]Barn P, et al. The effect of portable HEPA filter air cleaners on indoor PM2.5 concentrations and health-related outcomes: randomized intervention; ~29% indoor PM2.5 reduction. Sci Total Environ. 2018.
[27]Wang B, Zhou W, Yang C, et al. Emission characterization of particulate matter and polycyclic aromatic hydrocarbons from Chinese-style cooking. J Hazard Mater. 2015;283:714–721.
[28]Huboyo HS, Tohno S, Cao R, et al. Indoor PM2.5 characteristics related to water-based and oil-based cooking emissions using a gas stove; mean maximum PM2.5 reported up to ~749 µg/m³ under natural ventilation. Aerosol Air Qual Res. 2011.
[29]Daisey JM, Mahanama KR, Hodgson AT. Toxic volatile organic compounds in simulated indoor environments receiving secondhand tobacco smoke. J Expo Anal Environ Epidemiol. 1998;8(3):313–334. PMID: 9679214
[30]Chan W, et al. Cigarette-induced PM2.5 in hotel rooms: PM2.5 could reach ~586 µg/m³ (burning) and ~1368 µg/m³ (smoking) when ventilation is off. Indoor Built Environ. 2017.
[31]Schick S, Glantz S. Philip Morris toxicological experiments with fresh sidestream smoke: more toxic than mainstream smoke. Tob Control. 2005. PMID:16319363.
[32]Dobson R. Smoke from cigarette tip is more toxic than main inhaled smoke. BMJ. 2005.
[33]Klepeis NE, Ott WR, Switzer P. Real-time measurement of outdoor tobacco smoke particles. J Air Waste Manag Assoc. 2007;57(5):522–534.
[34]Hwang J, Lee K. Determination of outdoor tobacco smoke exposure by distance from a smoking source. Nicotine Tob Res. 2014;16(4):478–484.
[35]Repace J. Measurements of outdoor air pollution from secondhand smoke: concentration declines with distance and wind conditions. 2005
[36]Williams M, Villarreal A, Bozhilov K, et al. Metal and silicate particles including nanoparticles are present in electronic cigarette cartomizer fluid and aerosol. PLoS One. 2013;8(3):e57987.
[37]Li L, Lin Y, Xia T, Zhu Y. Effects of electronic cigarettes on indoor air quality and health. Annu Rev Public Health. 2020.
[38]Melstrom PC, et al. Measuring PM2.5, ultrafine particles, air nicotine and surface deposition following indoor e-cigarette use. Nicotine Tob Res. 2017;19(9):1055–1061.
[39]Olmedo P, Goessler W, Tanda S, et al. Metal concentrations in e-cigarette liquid and aerosol samples: evidence of toxic metal exposure (Cr, Ni, Pb, etc.). Environ Health Perspect. 2018.
[40]Heldt NA, Seliga A, Winfield M, et al. Electronic cigarette exposure disrupts blood-brain barrier integrity and promotes neuroinflammation. Brain Behav Immun. 2020 Aug;88:363–380.
[41]Hoek G, Krishnan RM, Beelen R, Peters A, Ostro B, Brunekreef B, Kaufman JD. Long-term air pollution exposure and cardio-respiratory mortality: a review. Environ Health. 2013 May 28;12(1):43.
[42]Liu C, et al. Ambient Particulate Air Pollution and Daily Mortality in 652 Cities. N Engl J Med. 2019 Aug 22;381(8):705–715.